DeFi Risk & Performance Framework
Disclaimer: This project is for educational and personal analytics purposes. It is not financial advice.
The DeFi Risk Monitoring Toolkit is a personal, research-driven framework designed to monitor, analyze, and manage risk across decentralized finance strategies, with a strong focus on capital efficiency, liquidity provision, and market making mechanics.
Built from real-world DeFi usage, this framework aims to bridge the gap between on-chain execution and institutional-style risk monitoring, inspired by practices found in traditional trading, treasury, and market making desks.
The objective is simple: turn fragmented DeFi positions into a coherent, risk-aware portfolio view.
Why this toolkit exists
Most DeFi dashboards show positions. Few show risk.
This toolkit is designed to answer, at a glance:
- What can hurt me today? (liquidation, out-of-range, leverage drift, concentration)
- What is working? (fees vs IL, carry vs price move, real net performance)
- What should I do next? (actionable alerts + prioritized checklist)
TradFi bridge: Think of it as a lightweight “risk desk” for DeFi, built for CLMM LPs, lending/borrowing strategies, and on-chain market making.
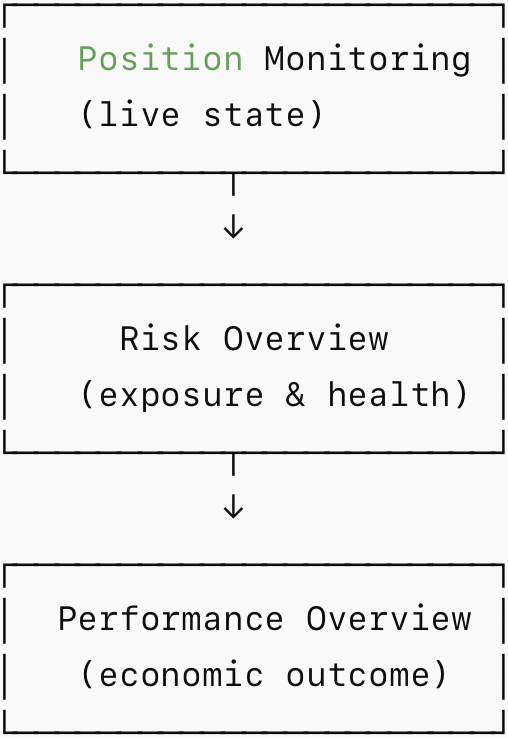
Framework flow
What it covers
1. Position Monitoring (CLMM / LP)
Track the live state of active DeFi positions.
- In-range/out-of-range status
- Inventory composition (token0 / token1) and position value
- Lending/borrowing health: LTV monitoring, liquidation distance
Designed to support day-to-day LP and CLMM position management.
2. Risk Overview
Aggregates risk indicators for inactive positions.
- Opportunity cost
- Call-to-action indicator
- Lending/borrowing health preview
Measures how inactive position improves risk.
3. Performance Overview
Measures real LP performance beyond headline APR.
- Net performance over time (position value + fees)
- Daily and cumulative performance tracking
- Fee management with harvest cadence per pool
Focuses on economic efficiency, not advertised yields.
Key metrics (the “risk desk” layer)
| Category | Metrics |
|---|---|
| Lending / Borrowing | Current LTV, liquidation LTV |
| CLMM / LP | Range status, Inventory drift, Fee velocity, PnL vs IL |
| Portfolio | Exposure by token / protocol / chain |
Architecture
- Storage: Google Sheets (fast iteration) + optional exports
- Logic: formulas + scripts (Apps Script)
- Outputs: dashboards, alerts, and weekly reports
Design rule: Every metric must lead to a decision: hold / rebalance / deleverage / exit / add.
Roadmap
- V1: risk overview (LTV + CLMM range monitoring + exposure table)
- V2: performance attribution (fees/IL/carry) with weekly snapshots
- V3: alerting system (threshold + anomaly detection)
- V4: automated report + “playbook” per strategy
- V5: hedging strategies (perp, options)